 Intelligent Routing · Blog
Intelligent Routing Saves More on a Road-trip in the USA
Recently at Discovery News, Tracy Staedter joined forces with Randal Olson, a doctoral student at Michigan State University, to work out a road trip that tells readers How to Really Drive Across the U.S. Hitting Major Landmarks. The major landmark trip across the U.S. gives us an opportunity to compare an existing, well planned, road trip with Intelligent Routing’s recommended route generated through the route planner.
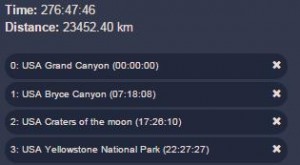
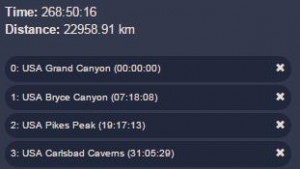
We were able to save 494 km equating to an estimated 8 hrs drive time when comparing the routes on Intelligent Routing. That is one work day less on the road! From an original plan of 23 452 km (277 hrs) down to 22 958 km (269 hrs) is about 2.1%, quite some savings if one considers that the trip was already well planned before we started.
The original sequence
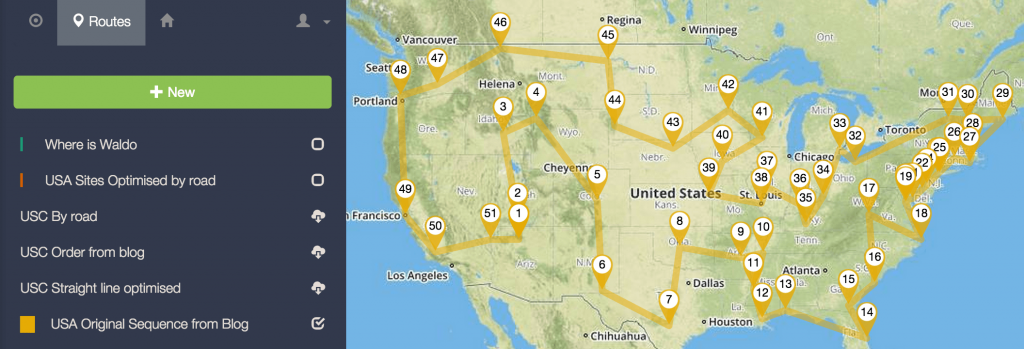
The trip computed by Randal Olson. Looks great, but can we shorten the trip with Intelligent Routing?
In order to get a base map, the original blog sequence was imported into Intelligent Routing. For this, we included the additional location, in Cleveland, that Randal included but that was not included in Tracy’s list. The _Intelligent Routing _optimization engine uses the directions and distances as received from GraphHopper. This gives us an indication that the original sequence would cover 23 452 km and take about 277 hrs to complete when following these directions.
We added the Grand Canyon as depot (position 0) and in the first position to get the sequence numbers to start at the same point as in the original blog post. This makes finding a location on the map simpler.
The optimized sequence
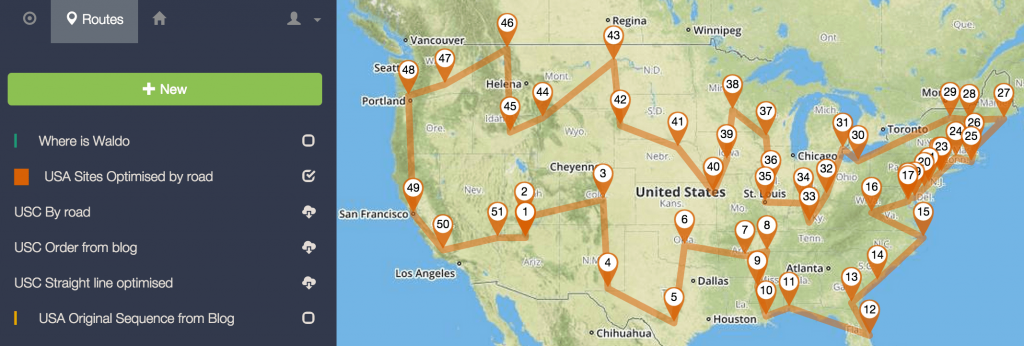
From the original sequence, we clicked on optimize (road) to get the recommended route.
The route is pictured below. Apart from the obvious difference at the start, where are all the savings coming from?
To find the points of savings, let’s have a look at the routes together.
Comparison
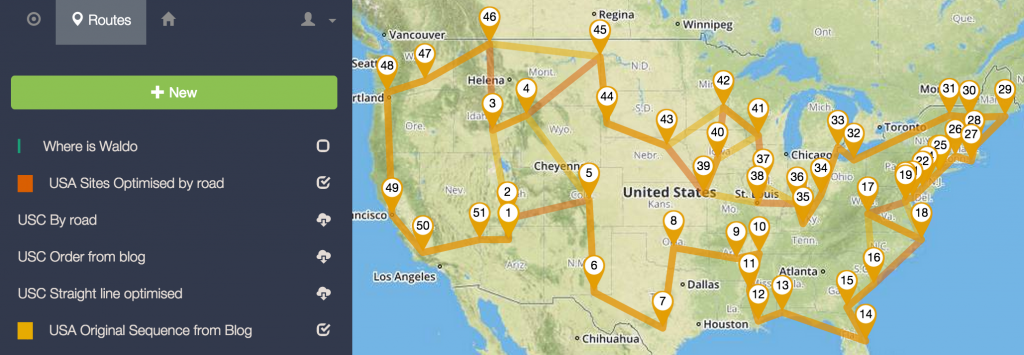
So, where are the savings coming from in the sequence optimized by Intelligent Routing? The routes look similar but take a look below when they are shown together (the sequence numbers are from the original order).
The first clear difference is at the start. The optimized sequence begins with 1 2 5 6 and later on comes back to Yellowstone and Craters of the Moon with 45 4 3 46.
Here is a closeup of the improvement:
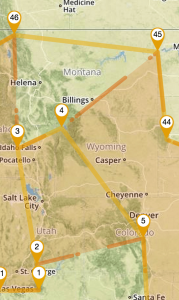
US Historic Sites Intelligent Routing Optimized follows 1 2 5 – and later – 45 4 3 46 to save 2 hours and 30 minutes
This improvement is not necessarily clear when compared to the original sequence since the two canyons and parks are slightly vague locations. Sometimes Google considers arriving at a park gate as arriving, which would make the original sequence an option.
The second area where the Intelligent Routing optimization differed from the original route was also noted by the people at the University of Waterloo’s maths department. Here is a close up in Intelligent Routing of the system’s proposed improvements.
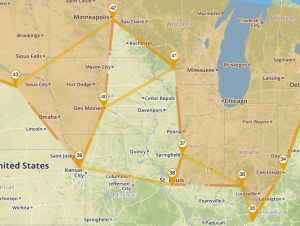
US Historic Sites: Intelligent Routing Optimized follows 36 38 37 41 42 40 39 43 to save 2 hours and 30 minutes
A saving of 2.1% overall is a lot more than we expected. Upon closer inspection we did find that some locations can have large influences based on fairly small changes in perspective (e.g. visit the north or south edge of the Grand Canyon, and where exactly?) To ensure that the comparison is as close as possible (as practical) we double-checked the locations.
Credit: Tracy Staedter – How to Really Drive Across the U.S. Hitting Major Landmarks (Discovery News)
Randy Olson – Computing the optimal road trip across the U.S.
GraphHopper
University of Waterloo
Written by the Intelligent Routing team who work hard to make vehicle route optimization software available to every business that runs a fleet.
You should follow them on Twitter
